Hello R Markdown
R Markdown
This is an R Markdown document. Markdown is a simple formatting syntax for authoring HTML, PDF, and MS Word documents. For more details on using R Markdown see http://rmarkdown.rstudio.com.
You can embed an R code chunk like this:
summary(cars)
##      speed           dist
##  Min.   : 4.0   Min.   :  2.00
##  1st Qu.:12.0   1st Qu.: 26.00
##  Median :15.0   Median : 36.00
##  Mean   :15.4   Mean   : 42.98
##  3rd Qu.:19.0   3rd Qu.: 56.00
##  Max.   :25.0   Max.   :120.00
fit <- lm(dist ~ speed, data = cars)
fit
##
## Call:
## lm(formula = dist ~ speed, data = cars)
##
## Coefficients:
## (Intercept)        speed
##     -17.579        3.932
Including Plots
You can also embed plots. See Figure 1 for example:
par(mar = c(0, 1, 0, 1))
pie(
  c(280, 60, 20),
  c('Sky', 'Sunny side of pyramid', 'Shady side of pyramid'),
  col = c('#0292D8', '#F7EA39', '#C4B632'),
  init.angle = -50, border = NA
)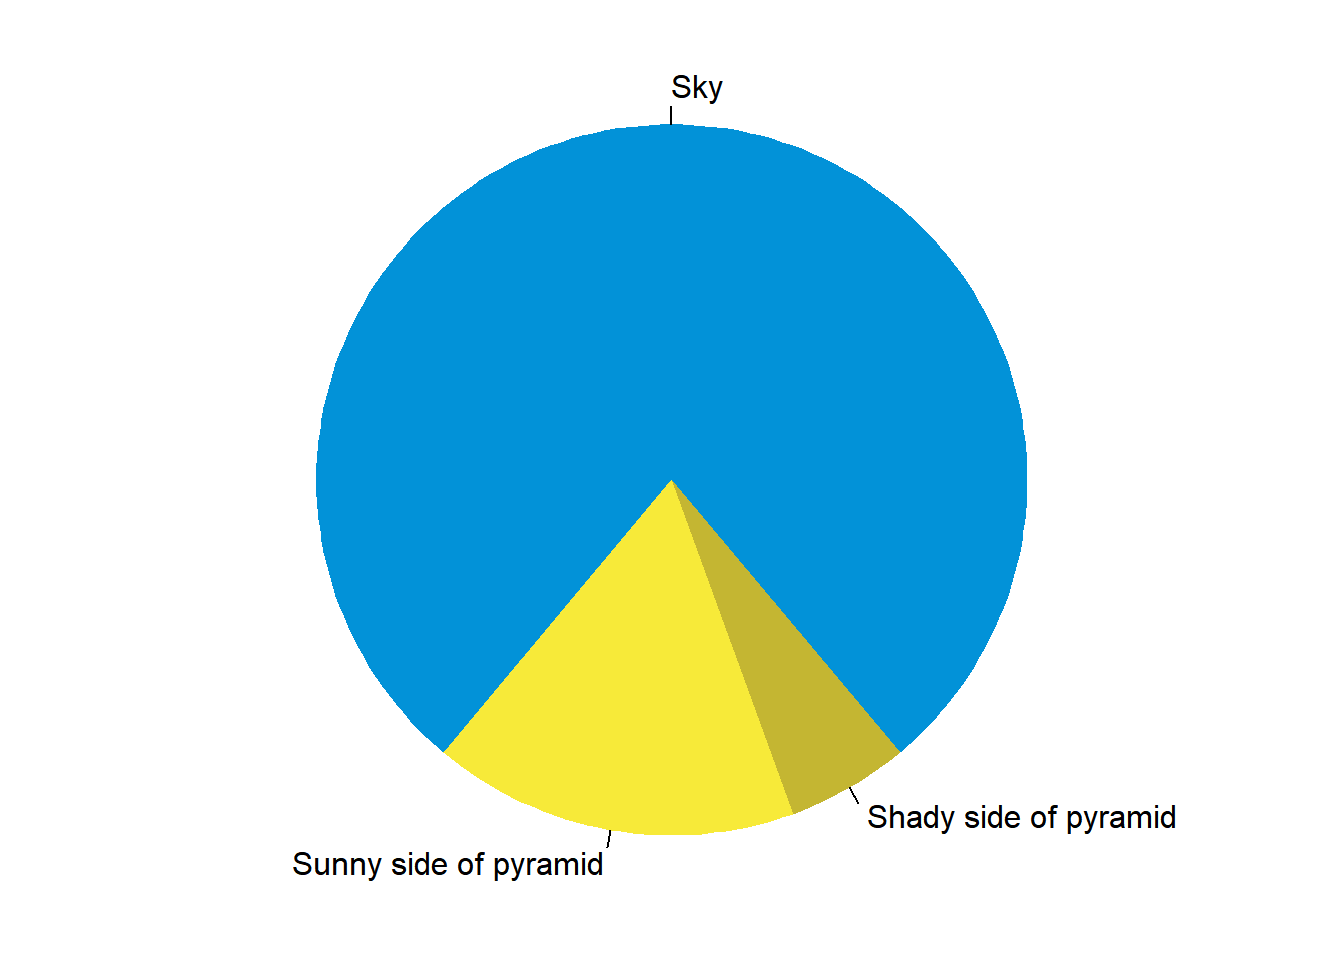
Figure 1: A fancy pie chart.
Alison Kleffner
Assistant Professor
My research interests include environmental applications of statistics and spatial data visualization. Currently, I am working on a project which involves the development of a spatial clustering and interpolation method to estimate where ice cracks may form and to infer missing data. These methods were developed with motion data of Arctic sea ice from the RADARSTAT Geophysical Processing System, where chunks of data are missing due to the data collection method. This is important as when cracks form in the sea ice, the heat from the ocean is released into the atmosphere, thus playing an important role in the global climate. Additionally, I have been working on a project focusing on visualization variables that occupy the same spatial domain with the goal to derive relationships between the variables.