Visualization and Modeling of Multivariate Data in Environmental Applications
Abstract
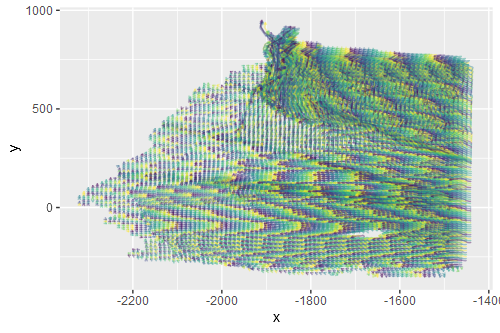
With the development of new technology, it has become easier to collect spatial and spatio-temporal data, which is common in environmental studies. First, we studied the movement of Arctic sea ice. Using the sea ice trajectories, we motivated the benefits of messy visualizations during exploratory data analysis, with one benefit being the ability to derive numerical features that summarize movement. Then, we assessed relevant features also using visualization. We used these relevant numerical features in a clustering algorithm to find clusters of like features. Leads, or cracks in the sea ice, are considered to have formed along cluster boundaries. We used the clusters to develop a non-stationary joint spatio-temporal model of the underlying process that causes the sea ice to move. The model can predict missing points along a trajectory (interpolation). We can infer that missing points in a cluster would move similarly to known points in the same cluster. Understanding how the sea ice moves and where leads form is influential information for climate models, as sea ice indicates the warmer ocean from the colder atmosphere. Through a simulated data set and the sea ice trajectories, we found our approaches found similar results, or in the case of interpolation, better performance in some situations. Second, we examined visualizations displaying the relationship between crop input application and crop yield. Comprehension of this relationship is essential to find an optimal application rate, as the inefficient application of crop inputs impacts profit and the environment. Maps attempting to display the data currently exist, but these maps do not adhere to the principles of effective chart design. We identified the perceptual issues in each current visualization and proposed plots to mitigate these challenges. By documenting the process of graphical improvement to increase comprehension and ease of use, these ideas can be used with similar data in the agricultural domain to display data better. Visualizing the data more effectively makes the information presented more attainable for people and may allow further insight into the data